Founder, Physis + Agency
Bellingham
2019-Current
We distilled thousands of conversations across the cannabis spectrum with consumers of all kinds—producers, retailers, doctors, therapists, social workers, parents, researchers, and public health advocates.
Then we distilled those, plus hundreds of research papers, our decade plus of experience with the industry in Washington State, and our own original research, into an accessible and comprehensive overview of how cannabis works, the most comprehensive guide to date.
Our book, How Cannabis Works: A Guide, is the most comprehensive overview to date and is available on Apple Books and Kindle. Read more here.
-
![A guide titled "How Cannabis Works" with the subtitle "A Guide" by Physis + Agency. The cover features a black background with a circular diagram drawn with white lines, containing the words "Strains," "Levels," "Subjects," "Interest," "Skills," "Session," "Experience," and "Matters." On top of the diagram, there are three cannabis-related items: a piece of cannabis flower, a green cannabis soap or block, and a small jar filled with cannabis concentrate.]()
How Cannabis Works: A Guide
-
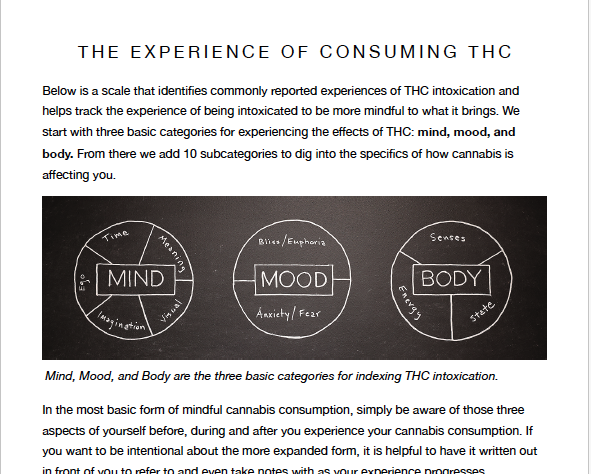
![An infographic titled 'The Experience of Consuming THC' with three black circle diagrams labeled 'Mind,' 'Mood,' and 'Body,' each with related subcategories and descriptions about THC effects.]()
The Experience of Consuming THC
-
![Graph illustrating THC intoxication levels, showing experience from negative to positive as dose increases, with four phases: Microdosing, Microdosing, Peak Euphoria, and Brainie Suttin.]()
Levels of THC Intoxication
-
![Cover page of a report titled 'Packaged Potency' with a subheading about innovative packaging in the cannabis market, dated February 2024. The cover features a colorful, neon-style graphic of the word 'DOR'.]()
Packaged Potency, a collaboration with Fight or Flight, Roland DGA, CensusWide and GoldLeaf
-
![A digital graphic design summarizing a report on cannabis packaging, featuring three images of cannabis product jars with colorful label designs against purple backgrounds, and text discussing opportunities for boutique cannabis producers and consumer preferences.]()
Packaged Potency
-
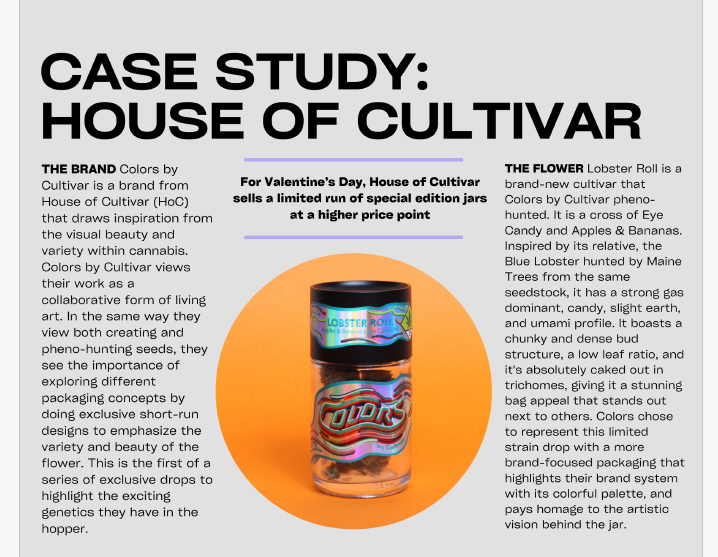
![A magazine page detailing a case study of House of Cultivar with the title 'CASE STUDY: HOUSE OF CULTIVAR.' The page features a central image of a jar labeled 'LOBSTER ROLL' with colorful artistic design, surrounded by descriptive text about the brand and its products.]()
Packaged Potency
-
![A report titled 'Report: By Numbers' featuring statistics on cannabis users, legal consumption states, and spending habits. Includes a quote about investing in packaging, a list of 25 states where cannabis is legal, and data on cannabis product worth, gifting likelihood, and spending intentions.]()
Packaged Potency
-
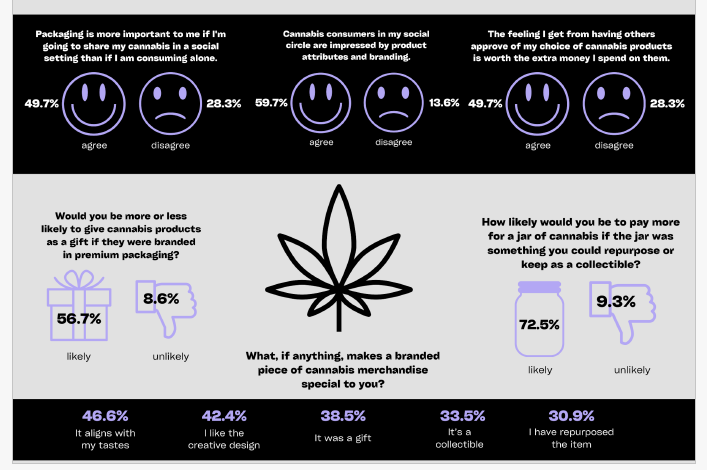
![Survey results on consumer attitudes toward branded cannabis merchandise and packaging, featuring percentage breakdowns for agree/disagree and likelihood to pay more or less, with a central cannabis leaf graphic.]()
Packaged Potency
-
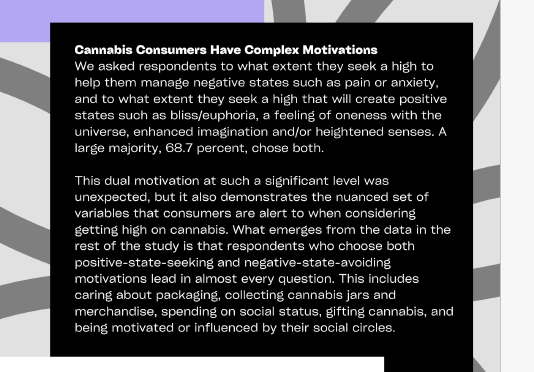
![A screenshot of a research report on cannabis consumers' motivations, discussing their search for negative and positive states related to cannabis use.]()
Packaged Potency